




Inside this case study
Business context and challenge
A 10-day ecommerce campaign in the Gulf recorded $28,550.14 in purchase value at 7.38 ROAS, with $3,868 in advertising spend. Ahmed Osama led an audience test across six Meta ad sets for a brand selling products through its mobile application and website.
The question was practical: which audiences could generate purchases, and which combined an attractive return with meaningful sales volume? The test brought broad, interest-based and lookalike approaches into one campaign assessment.
Ahmed Osama’s work
Ahmed Osama structured the campaign into six ad sets targeting six different audiences. The mix included broad audiences, interest-based audiences, and lookalike audiences based on an audience he had created inside the advertising account.
His work covered audience setup, running the 10-day Meta campaign and comparing purchase value and ROAS across the groups. The result was a clearer basis for deciding which audiences deserved further testing and potential scaling.
Campaign details
Testing Meta Ads audiences for ecommerce sales
The six-ad-set structure made differences between audience approaches visible. For a business selling through both an app and a website, purchase value connects media buying decisions to sales rather than treating traffic or installs as the final outcome.
What the six ad sets delivered
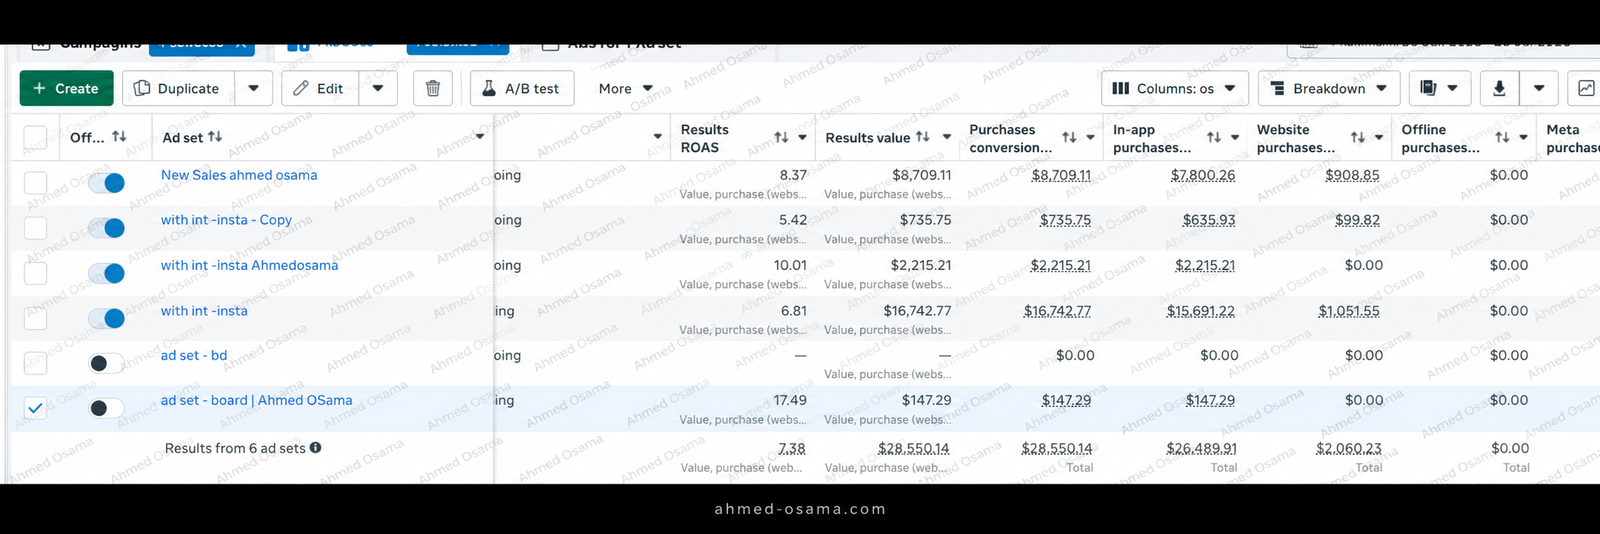
Names below match the report. They identify rows; the screenshot does not establish the exact targeting settings of each row.
| Ad set | Purchase value (USD) | ROAS |
|---|---|---|
| New Sales ahmed osama | $8,709.11 | 8.37× |
| with int -insta – Copy | $735.75 | 5.42× |
| with int -insta Ahmedosama | $2,215.21 | 10.01× |
| with int -insta | $16,742.77 | 6.81× |
| ad set – bd | $0.00 | — |
| ad set – board | Ahmed OSama | $147.29 | 17.49× |
The displayed total is $28,550.14. Adding the visible row values gives $28,550.13, a one-cent difference; the report’s total is used throughout this case study.
Highest ROAS and highest sales volume answer different questions
The highest displayed ROAS was 17.49×, attached to $147.29 in purchase value. It was a signal worth investigating on a small base. The largest sales contribution was $16,742.77 at 6.81× ROAS, while another group recorded $8,709.11 at 8.37×.
The useful outcome was an audience-by-audience view of return and sales contribution. A next-stage scaling decision should check spend, purchase volume and stability before treating the highest ratio as the strongest audience at a larger budget.
Mobile app marketing with measurable ecommerce outcomes
In-app purchases represented approximately 92.8% of reported purchase value, making the application central to this campaign’s sales result. The app and website breakdown keeps the analysis clear: neither app installs nor website visits are presented as purchases.
Plan an audience test for your app or ecommerce website
Explore Ahmed Osama’s media buying and paid ads services in Egypt and the GCC and mobile app marketing services. Start with a defined business outcome, a measurement plan and a budget that supports a useful audience comparison.
How did Ahmed Osama evaluate the six Meta Ads audiences?
Ahmed compared both purchase value and ROAS across the six ad sets. One audience generated $16,742.77 at 6.81× ROAS, while the highest ratio, 17.49×, came from $147.29 in purchase value. Reading those figures together helped distinguish a strong ratio from a meaningful contribution to ecommerce sales.
How much of the campaign’s purchase value came from the app?
Meta recorded $26,489.91 in in-app purchase value and $2,060.23 from website purchases. Together they made up the campaign’s $28,550.14 total. The app contributed approximately 92.8%, showing why app purchase campaigns were central to this Gulf ecommerce project.
More app and ecommerce campaign examples
See Ahmed Osama’s restaurant app tracking audit and lower purchase cost in Egypt, and the Snapchat ecommerce case study in Kuwait with 3,944 purchases.
Documented results
The Meta report shows $28,550.14 in total purchase value and 7.38 ROAS. In-app purchase value was $26,489.91, approximately 92.8% of the total. Website purchase value was $2,060.23, approximately 7.2%.
Using the campaign spend supplied by Ahmed Osama, $28,550.14 ÷ $3,868 = approximately 7.38. These are advertising-attributed purchase values, not net profit. App and website values are components of the total and are not added to it again.
Measurement scope and limits
The attached Meta Ads Manager screenshot supplies the displayed purchase values and ROAS. The 10-day duration, $3,868 spend, Gulf market and audience setup come from Ahmed Osama’s description of his campaign. The screenshot does not show calendar dates, timezone, attribution window or detailed targeting settings.
This was an audience performance test; the screenshot alone does not establish a randomized experiment or equal spend across ad sets. The client and exact country are not named. Results describe this period and do not establish future performance or incremental profit.

